

Best overall for self-managed server monitoring: Zabbix. Best for Windows-centered infrastructure: PRTG. Best for live host troubleshooting: Netdata. For small IT teams in 2026, the right choice is the tool your staff can maintain and turn into clear action—not the one with the longest feature list.
- Zabbix leads the best server monitoring tools for small IT teams that can maintain their own monitoring platform.
- PRTG suits Windows-centered infrastructure; Netdata suits live host troubleshooting.
- Prometheus fits application metrics; Checkmk fits mixed infrastructure with repeatable service checks.
- BritCore IT fits business teams seeking managed IT support rather than another monitoring console.
Why this matters
A server can answer a ping while its application fails. Useful monitoring checks the services people depend on, then gives someone enough context to investigate the failure.
BritCore IT fits business teams that want managed IT support instead of another monitoring console. Its managed IT support services cover ongoing business technology support, including servers, network equipment, and workstations. That is a different decision from choosing software your own staff will operate.
For a 2026 shortlist, separate visibility from responsibility. A dashboard shows a condition; your operating process determines who responds, what they check, and when they escalate.
What makes the best server monitoring tools?
Judge each tool against these criteria before comparing interfaces:
- Service visibility: Check application services and dependencies, not just processor load and memory use.
- Actionable alerts: Require a clear failure condition, affected system, responsible person, and recovery signal.
- Maintenance effort: Account for platform updates, agents, credentials, integrations, and configuration changes.
- Troubleshooting depth: Look for enough historical and live detail to investigate the systems you actually operate.
- Team fit: Choose a workflow that another technician can understand without depending on its original designer.
An extra dashboard is not an advantage if nobody maintains it. Favor checks that support an operational decision over metrics collected simply because they are available.
Server monitoring tools at a glance
| Tool | Best for | Standout capability | Key limitation |
|---|---|---|---|
| Zabbix | General-purpose, self-managed monitoring | Templates, triggers, and infrastructure monitoring | Requires ownership of the monitoring platform |
| PRTG | Windows-centered infrastructure | Sensor-based checks across servers and network devices | Sensor selection and alert tuning need planning |
| Netdata | Live host troubleshooting | Detailed host metrics and interactive charts | Host detail alone does not establish business-service health |
| Prometheus | Instrumented applications | Labeled time-series metrics and PromQL | Exporters and related components need engineering ownership |
| Checkmk | Mixed infrastructure | Host discovery and repeatable service checks | Discovered services still need selection and tuning |
These are distinct use cases, not interchangeable winners. Start with the operational problem: broad infrastructure coverage, familiar Windows administration, live diagnosis, application metrics, or standardized checks across mixed systems.
1. Zabbix: best server monitoring tool for general infrastructure
Zabbix monitors infrastructure through agents, network protocols, templates, and configurable triggers. It suits teams that want server and network observations in a self-managed monitoring platform.
Zabbix pros:
- Templates help apply consistent checks across similar systems.
- Trigger expressions let administrators define specific failure conditions.
- Historical metrics support investigation beyond the current incident.
Zabbix cons:
- Someone must maintain the monitoring server, database, and configuration.
- Broad metric collection requires disciplined thresholds and notification rules.
Best for: Small IT teams with an administrator who can own the monitoring platform and maintain shared standards.
For your 2026 pilot, begin with a representative server and its important services. Check whether a second technician can explain an alert using its message, linked history, and operating instructions. If interpretation depends on the person who configured it, simplify the setup.
Verdict: Buy into Zabbix as the default self-managed choice when platform ownership is assigned.
2. PRTG: best server monitoring tool for Windows-centered teams
PRTG organizes monitoring around sensors, which represent individual checks or measurements. It supports server and network monitoring through methods including Windows monitoring, SNMP, and other protocols.
PRTG pros:
- Sensor-based configuration makes individual monitoring checks visible.
- Server and network checks can share a monitoring interface.
- Windows-focused checks suit teams administering Windows infrastructure.
PRTG cons:
- A device can require several sensors, so device counts alone do not describe monitoring scope.
- Discovery does not remove the need to select useful checks and tune alerts.
Best for: Windows-centered teams that want to organize infrastructure monitoring around explicit checks.
Before expanding a PRTG deployment, list the conditions that deserve a notification. Separate an unavailable service from a temporary utilization spike. Those events need different responses, even when they appear on the same server.
Verdict: Buy into PRTG when its sensor model matches how your team manages Windows infrastructure.
3. Netdata: best server monitoring tool for live troubleshooting
Netdata collects detailed system metrics and presents them in interactive charts. Its strongest fit here is investigating what a host is doing while a performance problem occurs.
Netdata pros:
- Detailed host charts support examination of resource behavior.
- Live metrics help technicians investigate an active performance complaint.
- Application and system collectors bring related observations together.
Netdata cons:
- Host metrics do not prove that an entire business workflow works.
- A large amount of detail still requires someone who can interpret it.
Best for: Technicians who need close inspection of server performance during diagnosis.
Use Netdata to answer a defined question: is the problem associated with processor pressure, memory behavior, storage activity, or another observed condition? Do not treat a busy chart as proof of the cause. Confirm the connection with application behavior and relevant logs.
Verdict: Buy into Netdata for live diagnosis; skip it as the sole proof of business-service availability.
4. Prometheus: best server monitoring tool for application metrics
Prometheus collects time-series metrics, commonly by scraping application endpoints and exporters. PromQL lets engineers query those metrics, while Alertmanager handles alert routing and grouping in a typical Prometheus setup.
Prometheus pros:
- Labels let engineers examine metrics by service and other defined dimensions.
- PromQL supports application-specific queries and alert expressions.
- Exporters expose metrics from systems that do not provide a native Prometheus endpoint.
Prometheus cons:
- Exporters, alert rules, and associated components require ongoing maintenance.
- Poor label design can create unnecessary metric growth and operational work.
Best for: Small engineering teams that own application instrumentation and can maintain monitoring configuration.
Prometheus is a deliberate engineering choice, not a shortcut around server administration. In a 2026 evaluation, ask the application owner to demonstrate a meaningful failure alert and explain the query behind it. A graph without a service-level question is not enough.
Verdict: Buy into Prometheus for instrumented applications; skip it when nobody owns the metrics configuration.
5. Checkmk: best server monitoring tool for mixed infrastructure
Checkmk discovers services and applies checks across hosts and infrastructure. It fits teams that want a repeatable approach to monitoring different systems without designing every check individually.
Checkmk pros:
- Service discovery helps identify monitoring candidates.
- Rules support consistent configuration across related hosts.
- Host and service views help organize infrastructure health checks.
Checkmk cons:
- Discovered services require review before they become useful operational coverage.
- Rules and exceptions need clear naming and documentation as the deployment grows.
Best for: Small teams managing mixed infrastructure that need repeatable host and service checks.
Review discovered services with the person responsible for each system. Keep checks that reveal a failure someone can investigate, and document why exceptions exist. Discovery is a starting inventory, not an approved notification policy.
Verdict: Buy into Checkmk when repeatable checks across mixed systems matter most.
How the tools are ranked
This 2026 ranking prioritizes operational fit: useful coverage, understandable alerts, maintenance effort, troubleshooting depth, and shared ownership. It is a use-case comparison, not a measured performance benchmark.
Zabbix takes the default position for general self-managed infrastructure monitoring. PRTG, Netdata, Prometheus, and Checkmk take narrower slots because their operating models answer different needs. No tool earns a recommendation simply by collecting more metrics.
Run a pilot before expanding coverage
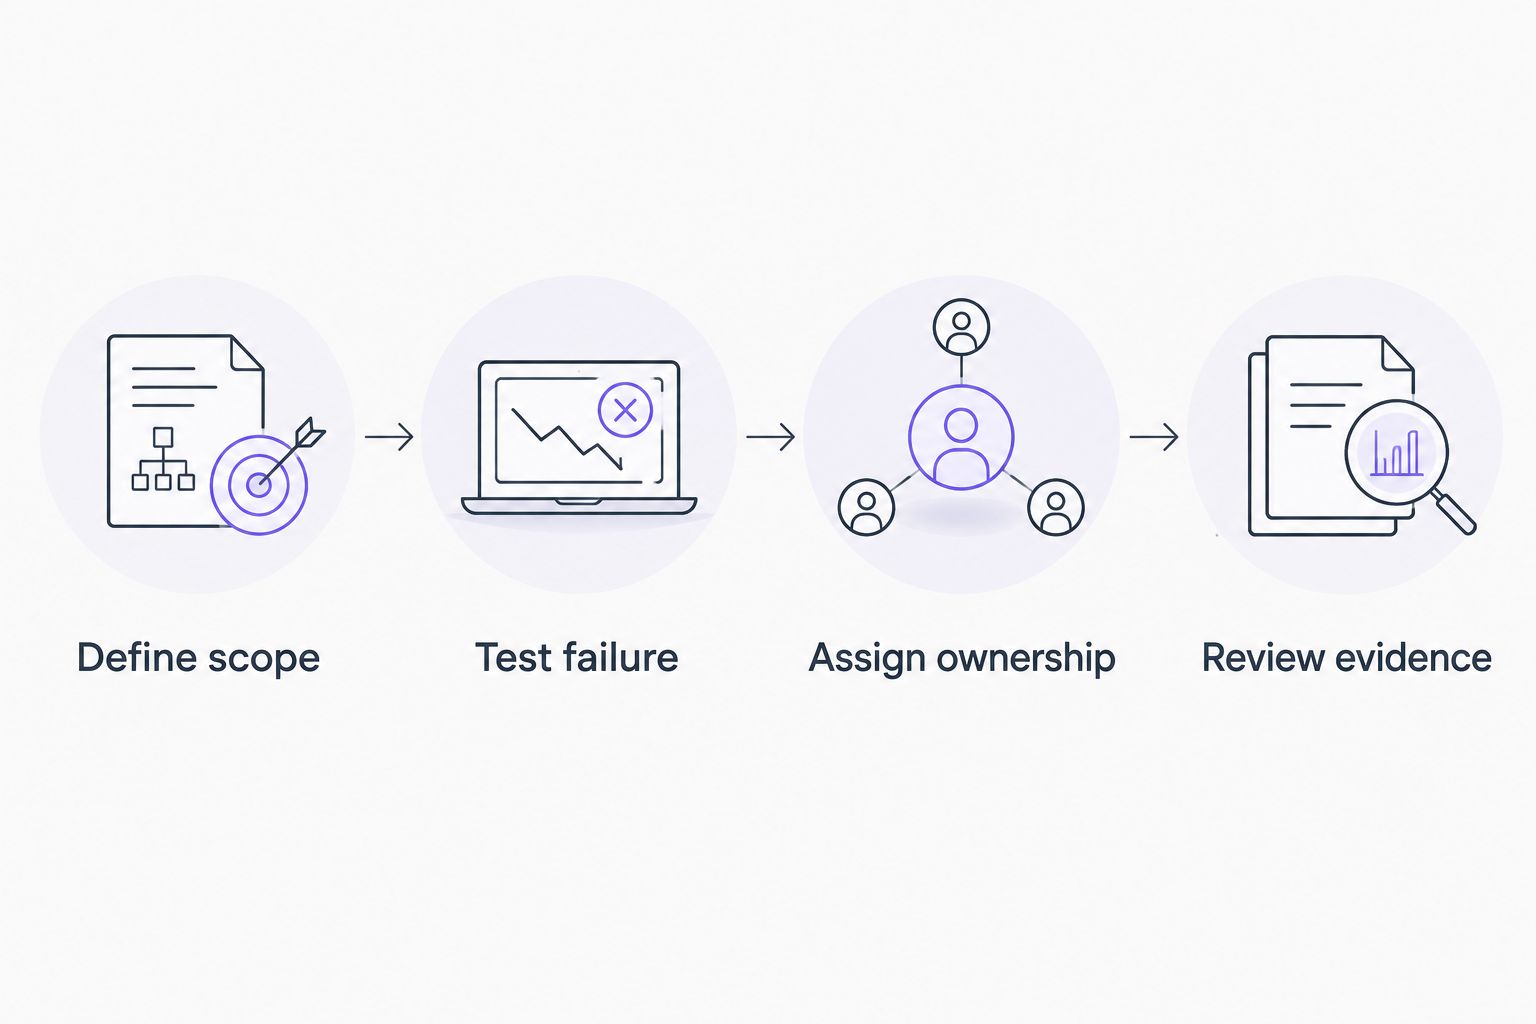
Use a 7-day pilot to test the operating workflow, not just installation. After rollout, review a 30-day trend window for recurring conditions and threshold adjustments. These are planning recommendations, not claims about how quickly a tool delivers results.
Define scope
Choose a representative server and a service that matters to its users. Write down what failure looks like from the user's perspective. Include dependencies that would change the investigation, such as network access or a database connection.
Test failure
During an approved maintenance window, test a safe, reversible failure condition. Confirm that the intended alert arrives and identifies the affected service. Then restore the service and verify that monitoring records the recovery.
Assign ownership
Assign 1 primary owner per alert, plus a documented escalation path. Decide who handles the event when that person is unavailable. Connect notifications to a recorded work item; choosing IT help desk software for small businesses is a separate workflow decision from selecting server checks.
Review evidence
Read the alert as someone who did not configure it. Can that person identify the system, understand the condition, and find the next diagnostic step? Remove duplicate notifications and revise instructions that depend on personal knowledge.
Keep the pilot record with your operating documentation. BritCore IT provides ongoing business IT support; if your team needs that service rather than software alone, discuss the systems and responsibilities involved before selecting a monitoring platform.
Separate server health from security monitoring
Server monitoring and security monitoring answer different questions. A stopped service is an operational condition. Suspicious authentication activity requires security investigation, and a healthy processor chart does not rule out a compromised account.
When budgeting for 24/7 threat monitoring costs, separate the work of reviewing security events from the work of tracking server health. Define who investigates suspicious behavior, who can authorize containment, and how security incidents reach the people responsible for business systems.
Do not assume either function includes the other. Ask for explicit scope covering data sources, notification handling, investigation responsibility, and escalation. An operational monitoring tool is not evidence that security events receive continuous human review.
This distinction also changes your pilot. A server-health test checks detection and restoration; a security exercise checks investigation and response authority. Keep both responsibilities visible rather than burying them under a single monitoring label.
Which server monitoring tool should you choose?
Choose Zabbix as the default for general self-managed server monitoring. Choose PRTG for Windows-centered administration, Netdata for live host diagnosis, Prometheus for application metrics, or Checkmk for repeatable checks across mixed infrastructure.
For 2026, make the final decision on operating responsibility. If your business needs someone to maintain its technology and support its users, evaluate BritCore IT as a managed IT support provider—not as another monitoring product.
FAQ
What’s the best server monitoring tool for a small IT team?
Zabbix is the default recommendation for a small IT team that can maintain its own general-purpose monitoring platform. PRTG, Netdata, Prometheus, and Checkmk fit the distinct use cases described in this comparison.
Is PRTG better than Zabbix for Windows servers?
PRTG is the better shortlist choice when your team prefers sensor-based checks for Windows-centered infrastructure. Zabbix remains the default here for broader self-managed monitoring; test each tool against your actual services.
Should a small business use Prometheus?
Prometheus fits a small business when its engineering team owns application metrics and monitoring configuration. It is not the default choice for a team seeking routine server checks without that engineering responsibility.
Can Netdata replace all server monitoring?
Netdata is a strong fit for live host troubleshooting, but host metrics alone do not prove business-service availability. Define application checks and alert ownership separately.
Does server monitoring include security monitoring?
Server monitoring does not automatically include security monitoring. Specify who reviews security events, investigates suspicious activity, and authorizes a response.
How should a small IT team test a monitoring tool?
Run a scoped pilot that tests a safe failure, alert delivery, ownership, and recovery. Keep the resulting instructions clear enough for a technician who did not configure the tool.
Can BritCore IT provide support instead of another monitoring tool?
BritCore IT provides managed IT support for business teams, including servers, network equipment, workstations, and structured user assistance. Discuss your systems and support responsibilities to establish the service scope.
One last thing
A recovery notification deserves its own test. Detecting a failure is only part of the workflow. Verify that the system recognizes restoration, closes the monitoring condition correctly, and leaves a record the next technician can understand.